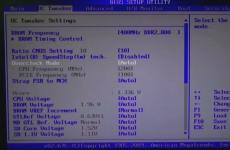
Image map in HTML. Creating links in image areas: link map Video lesson: Creating an image map in HTML
We have already talked about how to make a drawing a link... in this chapter we will talk about how to make a fragment, an area of a drawing, a link to a particular document, as well as how to make different areas of the same drawing links to different documents .
To accomplish this task, we cannot do without so-called navigation maps.
Let's say we have a picture like this:
And we need to do it so that the user, by clicking on one of these “buttons,” follows a link to this or that document.. what do we need for this?
First of all, let’s designate our drawing not as an ordinary graphic image, but as a navigation map, giving this drawing our own individual name. This is done using the attribute usemap tag
(I think you don’t need to be reminded that the tag
has a required attribute src which indicates the path to a particular picture
 )
)
Let's name our drawing/map panel. It will look like this:
usemap="#panel">
Do not forget to put the sign according to the rules of syntax # hash marks in front of the name..
Well, now, let’s actually create a navigation map. It is specified by the tag which has an attribute name- name.. do you see where I’m going with this? Well, as you probably already guessed, we will indicate on the basis of which drawing we will build our navigation map by indicating its name..
Now let’s start by indicating to the browser the areas of the picture that will serve as links, and at the same time we’ll write down the transition paths for these links. This task is taken over by the tag , it does not require a closing tag, and has the following attributes that we will work with:
href- indicates the path to the document to be opened (just like in the tag )shape- the shape of the drawing area that will serve as a reference. Can have one of three meanings:
- rect- rectangular area
- poly- the area is a kind of polygon
- circle- area defined by a circle
Rectangular area
Now our map looks like this:
In fact, now the “green” square button has become working.
As you can see by clicking on it in this example:
 usemap="#panel">
 I was a little hasty with the example without really explaining the essence of what was written... Let’s focus on the tag attributes .
href="primer1.html"- here I think it’s clear, this is the path to the document that should open when you click on the “green button”.
Since our button is square, and a square, as we know, is a “regular” rectangle, we assign the shape of the drawing area to rectangular shape="rect" .
And now the fun part coords="15,15,82,82"- coordinates.. For a rectangle, they are specified by two points according to the principle “X1, Y1, X2, Y2” Where X1, Y1 is the first point and, accordingly, X2, Y2 the second. Coordinates are indicated in pixels. Our drawing/map has dimensions of 300 by 100 pixels, its uppermost left pixel has coordinates X=0,Y=0, and the lowest right pixel X=300,Y=100. If it’s not clear, let’s dive into fifth grade geometry..
Take a look at the picture:

So, choosing a rectangular shape shape="rect" For our area in the form of a square button, we indicated the coordinates of its upper left and lower right pixels... which are quite enough to designate the “working” area of the entire button.
Polygon (polygon).
Let's deal with the “yellow button”, it is represented in the form of a triangle. In order to select its “working” area from our drawing, we assign the attribute shape meaning poly- a polygon that will define this area as a kind of polygon, where the coordinates separated by commas will be its vertices, there can be as many of them as you like “X1,U1,X2,U2,X3,U3,X4,U4... X124,U124” the figure formed by these the points and vertices of the corners can look like any polygon, both regular and irregular. In our case, there are only three angles, that’s why it’s a triangle, therefore its coordinates will be given by three pairs of values “X1,Y1,X2,Y2,X3,Y3”
So we write everything together like this:
shape="poly" coords="148,15,185,82,110,82">
And here is a picture that clearly shows where the coordinates of the points come from..

Circle
Well, the last “red button” is round... which means the shape of the area will be round shape="circle". This time the situation with coordinates is a little different. We will need three values X, Y, R. X and Y are the coordinates of the center of our circle, and R is the length of the radius in pixels.
Here is the drawing:

Here's an example:
Let's bring it to mind..
Now a little about what else it would be advisable to do with our map before “mounting” it into any page.
Let us define the fixed dimensions of the picture-map by attributes width And height
Let's write alternative text both for the entire map image and for its individual areas using the attribute alt, as well as a description of elements with the attribute title .
Let's get rid of the border frame... let's do it border="0"..(well, if you like it better with a border, you don’t have to do it.. I don’t insist..)
In the end it should look something like this:
 width="300" height="100" border="0" alt="Control Panel" title="Control Panel">
!}
width="300" height="100" border="0" alt="Control Panel" title="Control Panel">
!} Intersection of regions
Sometimes it is convenient to form the “working” area of an image by “mixing” different shapes.
Let's say our next button looks like this:

Of course, you can define the shape as a polygon, but you will have to specify a lot of coordinates for the round part of such a button (well, if you need special accuracy in the navigation map).
In this example, you can define two rectangle shapes rect and circle circle as it shown on the picture:

And in the code indicate the path to the same document:

"Not an area"
Let's look at an example... suppose you need to make a button like this:
What about the hole in it?
Tag besides the attribute href has an attribute opposite in value nohref- an inactive area, that is, if the user clicks on such an area, then absolutely nothing will happen, which is what we actually need to achieve when making a “hole” in our map.
The map will be defined by two areas, an inactive circle circle and active rectangular area rect and as shown in the drawing, have the following coordinates:
As mentioned earlier, when areas intersect, the highest priority will be given to the area that is inside the tag in the code listed first
Therefore, the example will look like this:

Map on the server.
Excerpt from directory (tag attributes
):
ismap- the image is a navigation map on the server.
Unclear? Then let's read...
With attribute usemap We seem to have figured it out.. Look, the user (client), having opened your page, simultaneously with all the other content, loads “on his side” both the drawing itself and the navigation map for it, and the whole thing is processed by his browser.
And here is the attribute ismap tag
tells the browser that there is a navigation map for this image on the server, well, where you have posted or are going to post your website (read the article:). And now, when a visitor (client) clicks on any area of the picture with such an attribute, the browser will remember the coordinates of this click and send them to the server, where a special program will process this data and redirect the user to the address indicated in the map on the server, in accordance with the coordinates of the point received from the client browser.
It is written like this:
Where address of the navigation map on any website.. hosted on one server or another..
Still not clear? If yes, then don’t bother about it.. use usemap, in my opinion, this solution will be the best in most cases when using navigation maps.
To easily determine the coordinates of a particular point on your navigation map, open the drawing with a graphic editor like Paint, for example... there, when you move the pointer over the drawing, you will see two changing numbers, these are the X and Y pixel coordinates in this drawing . In Paint, this panel is located at the bottom of the screen.
When creating a page with a navigation map, the tag
must always be higher than the card itself That is, write like this:

You can, but it’s not necessary.. because problems may arise when loading the page, since the map with the markings has already loaded, but the drawing itself has not yet..
And as for loading...
This place in the code can contain anything long text, tables, graphics... but it’s still better not to write anything here
And write here, because while the page is loading, the user, without waiting for it to finish, may try to click on the buttons indicated in the navigation map, which by this time has not yet loaded..
Let's look at an example of what an image map looks like in html:
When you hover your mouse over the area of the green rectangle, you can see that it is a link to “#green_link” (the label was chosen as an example; you can make a link to any page on the Internet). The red square has "#red_link", and the blue circle has the corresponding "#blue_link".
Code for this example:
img/primer-kartu-izobrazheniy-1.jpg">
As you can see from the example, the code is not that complicated. Let's look at the tags to create an image link map.
Description of the example1. You need to create an image link and maps
When creating a link map, the usemap attribute is required for the img tag.
2. Description of the map
3. Each map element is described using a tag , which specifies the type of object using the shape attribute (rectangle, circle, or polygon) and its coordinates.
NoteAreas may overlap each other. In this case, the link will lead to the object that was described last.
Tag attributes
1. Shape="object_type" attribute - specifies the object type. Can take the following values:
- circle - circle;
- rect - rectangle;
- poly - polygon;
2. Attribute coords="coordinate_values"- determines the geometric location of the object and its dimensions.
The reporting point of the image is the upper left corner. Those. if you specified a height offset of 10, then this means 10 pixels down.
Depending on the type of object, you need to specify coordinate values in different formats. All values are indicated in pixels (there is no need to write the px mark).
- For the circle type: coords = (x,y,r) , where x,y are the coordinates of the center of the circle, and r is the radius of the circle;
- For the rect type: coords = (x1,y1,x2,y2) , where x1,y1 are the coordinates of the upper left point of the rectangle, x2,y2 are the coordinates of the lower right point of the rectangle;
- For poly type: coords = (x1,y1,x2,y2,...,xn,yn), the x,y coordinates of each point of the polygon are sequentially indicated;
3. Attribute href="referral_address"- sets the link to go to (similarly). In addition to the jump address, you can use JavaScript functions to perform some action.
4. Target="value" attribute - similar to a tag defines the action of following a link. Can take values:
- _blank - opens the page in a new window
- _self - loads the page into the current window
- _parent - loads the page into the parent frame
- _top - cancels all frames and loads the page in the full browser window
5. Attribute title="hint" - выводит всплывающую подсказку. можно также сделать более красивую всплывающую подсказку: как сделать красивую всплывающую подсказку для ссылки »!}
6. Nohref attribute - makes the area inactive. Used when overlapping objects. It is used quite rarely, but sometimes it can become an indispensable solution. For example, you can make a small circle inside a large circle inactive.
The nohref area must come first.

Sample code:
The use of a link map in an image occurs only in a narrow range of tasks. For example, when creating some kind of diagram or travel map. In other cases, the use of a map when creating menus and other graphic elements seems unreasonable.
01.12.2015
Hi all!
Let's continue learning the basics of HTML. . An image map is also called a navigation map, but this is not that important.
Let's find out what an image map (navigation map) is and where it can be used in practice.
Image Map (navigation map) is a picture on which one or more specified areas for links are placed.
If you don’t understand much, I’ll say this: there is one picture on which a selected area can be placed (circle, rectangle, square, etc.) and addresses to other sites or to your pages are linked to this area.
The example used one picture, where the area and transition path are different

Now let's learn how to create something similar.
In order to create an image map, you will need to remember and a web page.
Let's move on to practice.
How to make an image map in HTML
To create an image map in HTML, paste this wireframe:
○ tag map
Tag
is the main container for creating an image map, inside which contains other tags such as .
The closing tag is required.
* tag attributes map
○ card name
The map must be given a name and for this use the “name” attribute:
○ tag area
Tag - this tag is intended to indicate a geometric area with a link.
* tag attributes area
○ how to determine the shape of an area
To define the shape of an area (rectangle, circle, polygon) use a tag attribute "shape" with the following values:
- rect - Rectangle. Example: shape="rect" ;
- circle - Circle. Example: shape="circle" ;
- poly - Polygon. Example: shape="poly"
○ how to specify the location of a geometric shape
To indicate the location of a geometric shape (rectangle, circle, polygon) use for tag "coords" attribute.
The “coords” attribute specifies all the parameters for placing a geometric figure according to the following scheme:
Coords="x1,y1,x2,y2"

Notice the vertical "y" axis and the horizontal "x" axis. It is along these axes that the parameters are set.
Coords="x,y,R"

Coords="x1,y1,x2,y2,x3,y3,x4,y4,x5,y5"

Rectangle
For example, I have this picture of rectangles:

Let's insert the image into the html document:

Now we create a block for the image map and give it any name through the “name” attribute, for example “karta1”
The card name must be separated by a hash “#”:

Now in the tag We indicate the coordinates, geometric shape and link to go to.
Here are the coordinates of the first rectangle:
x1=25, y1=36, x2=114, y2=98
and these will be for the second:
x1=153, y1=11, x2=219, y2=127
Here is the finished code:

View the finished code. Everything is clear to you, if not, look at the tags from the very beginning to create a navigation map. If this doesn't help, write in the comments.
And we look at the result, what happened to me. Try pointing at rectangle No. 1, and then at rectangle No. 2 (you can click, they are clickable):
Circle
For example, I have this picture of a circle:

Here are the coordinates of the first circle:
x=46, y=48; and the radius length is R=35
and here they will be for the second round:
Before looking at the finished code, try to write the HTML code yourself and compare it with mine.
The finished code will look like this:

I will repeat once again in the explanations what I did in the code:
Line No. 1
I inserted the image into the HTML file and linked the image to the map using the “usemap” attribute:

Line No. 2
I created a block for an image map and gave the map a name to link to the image using the “name” attribute:
Please note the name of the card ( name="name") must match the image anchor ( usemap="#name"). This is important because the image map will not work.
Line No. 3 and No. 4
Specified the figure and its coordinates, and also attached a link to the figure
So, if you did everything correctly, the result will be like this:
Try pointing at circle No. 1, and then at circle No. 2 (you can click, they are clickable)!!!
Polygon
For example, I have this picture of a figure with several angles:

Here are the coordinates of the first polygon:
x1=168, y1=9, x2=232, y2=29, x3=200, y3=97, x4=223, y4=129, x5=153, y5=119
and here they will be for the second polygon:
x1=54, y1=20, x2=109, y2=20, x3=147, y3=58, x4=109, y4=96, x5=54, y5=96, x6=16, y6=58
The finished code will look like this:

The result will be like this:
I would like to add that there can be as many angles as you want and as many as you specify:
Explanation:
x1, y1-
coordinates of the first corner;
x2, y2-
coordinates of the second corner;
xN, yN-
last corner coordinates
ADDITION:
Combined image map
The image map can be combined with different shapes at once. What I mean? In one picture, different areas of different figures can be indicated.
For example, like this:

In the example, I specified the area for the circle and for the rectangle.
For each selected area, you can specify tooltips that will appear when you hover the mouse cursor. For a hint, use the “title” attribute to the “area” tag:

Here's the result:
Hover your mouse over the circle and then over the rectangle. You will see tooltips appear, with “wordpress” in the circle and “Blog Author” in the rectangle.
So we've mastered it HTML image map. The most difficult thing in an image map is to calculate the correct coordinates of the figure. There is no special formula and you have to select coordinates several times.
I look forward to seeing you in the next lesson. Subscribe to my blog updates.
Previous post
Next entry
Recently, many Web pages use so-called image maps to organize links. The implementation of this feature is provided by the HTML language and allows you to bind hypertext links to various areas of the image. This approach is more visual than using ordinary text links, since the user does not have to read a verbal description of the link, but immediately understands its meaning from a graphic image.
Even a novice user, having wandered through the Internet, will soon come across an image map. In Fig. Figure 6.1 shows the Web page of one of the largest computer companies in Russia. The main menu on this page is an image map with corresponding links.
Launch of the famous search engine Yahoo! also results in a page containing an image map. The topmost part of the image shown in the figure contains four buttons with the word "Yahoo!" written between them. The cursor in the figure points to the first of these buttons, and the shape of the cursor makes it clear that the latter points to a link, the address of which is visible in the browser status bar. The links implemented by these buttons are made using image map technology.
However, one should not assume that image maps should be used everywhere where link navigation is required. You need to consider whether it makes sense to use image maps in a particular case, weighing the pros and cons. This chapter contains all the information you need to know about using image maps.
In this chapter you will learn:
- What is an image map and how does it work?
- How to create an image-map configuration file
- How to Create Links in an HTML Document Using an Image Map
Rice. 6.1. An example of a Web page in which the main menu is made using an image map
- What principles should be followed when using image maps?
- What are the features of different image map configuration file formats?
- What software should you use to create image maps?
Image Map Basics
Image maps provide users with a friendly interface to navigate to other Web pages. To follow such a link, you simply select the desired location in the image and click. The presence of such a developed graphical interface is one of the significant advantages of Web pages compared to other Internet resources. Instead of text menus similar to the Gopher client interface, users receive a clear graphical representation of information (Figure 6.2).

Rice. 6.2. Visual representation of links (to pages telling about the seven wonders of the world) using an image map
The image map looks like a regular embedded image, but when you select a particular area on this image with the mouse cursor, it navigates to other pages. Usually the image indicates where to click to go to a particular page. There are several ways to specify the boundaries of areas that implement various links. Often a frame or some other delimiter is used.
Let's look at the basic concepts associated with using image maps.
Terminology
Imagemap, Image Map, Area Map, Clickable Map, Sensitive Map - all these English terms are used in reference literature to denote the same possibility - the use of an image embedded in an HTML document for which “hot” (or active) points are defined or areas that link to different URLs. We will describe this possibility with the phrase “image map”, meaning a combination of several components that ensure the implementation of this concept. The main components are: the image itself, which we will call the reference image for this image map; description of the configuration of active areas; as well as related software.
Graphic representation of the image map
An image map is essentially an embedded graphic on a Web page. These images can be in any valid format (GIF or JPG). In this case, the GIF format can use a transparent color, as well as an alternating line mode. In order for an image to be used as a reference for an image map, no additional restrictions are formally imposed.
Description of image card configuration
The image map configuration is written in plain text, which, depending on the format used, can be saved in a separate file or be part of an HTML document. The configuration description contains the coordinates for each of the active areas of the image, as well as the URLs associated with each of these areas. Hotspots can be shaped like rectangles, circles, or polygons. Any combination of these figures is allowed. A single URL value can also be specified for when the user clicks within the image but outside of any of the specified hotspots. The specific rules for recording the scope configuration depend on the chosen implementation option and will be presented below.
Options for implementing image maps
The concept of an image map on Web pages can be implemented in two different versions - a server-side imagemap and a client-side imagemap. The latter name is often used as an abbreviation CSIM. Historically, the server version of image maps was the first to appear and become widespread, which was first implemented in the Mosaic browser. The server version allowed the use of the first versions of all three leading browsers. The server version can be implemented in two different formats, which are named after the names of the developer organizations - NCSA and CERN.
Recently, the client version, which was first implemented in the Microsoft Internet Explorer browser, has been increasingly developed. As of version 2.0, this option also supports the Netscape browser. This option has its undeniable advantages and is becoming increasingly popular.
Advantages and Disadvantages of Image Maps
There are both positive and negative aspects to using image maps. Most of them are aesthetic in nature, but some also have technical aspects. To create good Web pages, it is important to understand the advantages and disadvantages of image maps.
Image maps are most convenient to use in the following situations:
- To represent spatial relationships, such as geographic coordinates, that would be difficult to define with separate buttons or text. An example is a map of North America, where selecting each state takes you to the corresponding page.
- As a top-level menu that appears on every page. The presence of such a menu makes it possible to go to the section of the server of interest from any page and at any time. Creating a common graphical menu will reduce development time
HTML documents, since the same link description file will be used. Instead of making links on each page to different parts of the home page, you just need to link to the general menu. Such a menu will also make navigation easier for the user.
Despite the fact that image maps have become extremely popular, it is clear that they are not an integral attribute of Web pages and are not used on all pages. There are situations when you should not use image maps.
The disadvantages of image maps include the following:
- If an alternative text menu is not provided, there is no navigation available for users who cannot load graphics or have disabled loading of graphics.
- Image maps share the same disadvantages associated with using images on Web pages, namely, a significant increase in loading time compared to purely text documents.
- Poorly designed images can create confusion. Sometimes it can be difficult to determine which areas are active in an image. This is especially difficult to do in the server version. When implementing the client version, the situation is simplified, since it is possible to move the mouse within the image and monitor the appearing link addresses at the bottom of the browser window.
- When using image maps, the browser does not have the ability to mark links that have already been visited with a different color in the same way as it does for text links.
Server-side implementation of image maps
Using image maps on Web pages turns out to be a little more complex than simply embedding interesting graphics and linking them to links. To implement the server version of the image map, it is necessary that the HTML document be hosted on the server. It is also required that the server be configured to support CGI scripts (Common Gateway Interface), which process requests received from the browser when working with an image map. For each image map, a file describing the configuration of active areas must be placed on the server. When you click within an image, the coordinates of where you click are sent by the browser to the server, which accesses a configuration file, which is essentially a hotspot lookup table. The search result is returned to the browser in the form of a URL or a message indicating that no hotspots were found that match the specified location in the image.
To ensure the functioning of the image map, it is necessary to indicate that this image is the reference image for the map. This is done by setting the ISMAP parameter in the tag . In addition, the image map must be made a link on the Web page, much like using the entire image as a separate link.
As a reminder, inline images can be used as hypertext links if they are included in a tag<А>. For example, to make an image named Myimage.gif a graphical link to a document in the same directory named exampie.html, you would write:
<А HREF=example.html >
This HTML tells the server that when the Mylmage.gif image is clicked, a Document named example.html should be returned to the browser.
ISMAP parameter added to the tag for the example given, activates the image map. The link in this case is not to a specific document, but to an image map configuration file containing the coordinates of all active areas of the image. The configuration file, usually with a MAP extension, is parsed by a CGI program on the server along with the coordinates of the click point on the image. Then instead of the above line you should write:
<А HREF=MyImage.map>< IMG SRC=MyImage.gif ISMAP>< /A>
The link in this example is not the address of another HTML document, but an image map configuration file that contains coordinates for each active area of the image, named Myimage.gif.
Note
Order of tag parameters is arbitrary, however, the ISMAP parameter is usually placed last.
An image-map configuration file is a plain text file that contains information about the active areas of a given image. Each image that will be used in map mode requires a separate configuration file.
Advice
Each image card requires a separate configuration file. Make it a rule to save the configuration file in the same directory and with the same name as the image associated with it. For example: main_menu.gif and main menu.map.
There are two image map configuration file formats, developed by CERN and NCSA and bearing the names of these organizations. Both of these formats contain the same information, but present it differently. Both cases use the same types of areas, which are discussed below. When developing image maps for use on a specific server, you must obtain information from the system administrator about the method adopted for supporting image maps on that server.
Both formats use active areas in the form of rectangles, circles and polygons, and can also specify a so-called default area, which characterizes all points in the area that do not belong to any of the active areas. If the user clicks inside the image but outside of any of the defined hotspots, the URL will be set to the value defined by the default type.
For each area, a URL is written in the configuration file that will be returned to the user when a click occurs within that area. This address can be written in either relative or absolute form. Note that the relative URL must be defined relative to the location of the configuration file, not the image file. The list of active areas in the configuration file is read starting from the first line. If two scopes overlap, then the link whose scope description appears first in the configuration file is implemented.
Advice
It is recommended to always set a default link in the configuration file. The default link will be implemented for areas of the image that are not active. In the simplest case, the default URL could simply point to a page with useful information about using a given card.
CERN format
CERN is a European scientific center whose research topics are very wide. It was here that the concept of the World Wide Web system was developed, which was the impetus for all developments in the WWW area. CERN can rightfully be considered the birthplace of the Web. When the need arose to develop a structure for image map configuration files, CERN proposed the following format:
area type coordinates URL
The values of the X and Y coordinate pairs are separated by a comma and enclosed in parentheses. The CERN format does not allow comments to explain references related to a particular area. The following area types can be used: rect, circle, poly and default. This format allows the names of area types to be written in two ways - both in abbreviated and full form. Along with the given type names, the names rectangle, circ and polygon can be used.
Here is an example of recording information about areas on an image map in CERN format:
rect (56.47) (357.265) http://www.anywhere.com/
circ (366,147) 109 http://www.anywhere.com/
polygon (534.62) (699.62) (698.236) (626.261) (534.235) (534.62)
http://www.anywhere.com/
NCSA Format
The National Center for Supercomputing Applications (NCSA) at the University of Illinois has also made significant contributions to the development of the Web. The first popular graphical browser, the Mosaic program, was created here. NCSA proposed a configuration file format that differs in recording form from the CERN format. This format looks like this:
area_type URL coordinates
The following area types can be used: rect, circle, poly, default and point.
The X and Y coordinates are separated by commas, but are not enclosed in parentheses. This format allows the use of comment lines. Any line starting with a # character will be treated as a comment and its contents will be ignored by the parser.
The NCSA format offers a slightly different way to define circular areas (compared to the CERN format and the client version discussed below). A circular area is defined by the coordinates of two points - the center and any point lying on the circle.
Note
The NCSA format allows the use of a point area type. This area type is not used either in the CERN format or when using the client version of image maps. The intention of the creators of the format was that if there were a number of dotted areas, a mouse click would activate the link that was closest to the others. However, the presence of this type of area essentially conflicts with the default area type, since when using the point and default areas simultaneously, the implementation of a link defined by the point type is possible only if the mouse hits the given point exactly. This is quite difficult and is unlikely to create comfortable conditions when working with such a document. Currently, the point type is practically not used, and the client version of image maps is becoming increasingly developed.
Here is an example of writing a configuration file in NCSA format:
# Example of writing a configuration file
rect http://www.anywhere.com/ 56.47 357.265
circle http://www.anywhere.com/ 366,147 366,256
poly http://www.anywhere.com/ 534.62 699.62 698.236 626.261 534.235 534.62
Client version of the image map
The client version of the image card allows you to place all the information about the card configuration in an HTML file in which the image is embedded. In the case of using the server option, the browser sends a request to the server to obtain the address of the selected link and waits for a response with the required information. This may require additional waiting time. With the client version, the number of calls to the server decreases and the speed of access to information increases. In this option, there is also no need to contact the server to edit the map configuration, so all the work on creating an image map can be done locally, simultaneously with editing the HTML file. Unlike the server-side option, which required a separate configuration file for each image map, in this option, the map configuration can be located directly in the same HTML document in which the reference image link is specified. Most often, this is exactly what they do, although it is acceptable to save the card configuration in a separate file and provide a link to it.
To indicate that the embedded image is a reference for the map, use the USEMAP tag parameter . The value of the USEMAP parameter is a reference to a description of the map configuration.
Note
The Netscape browser does not allow a separate file to describe the card configuration.
For example:
In this example, the image stored in a file named l ogo.gif is the reference image for the client-side image map.
The hotspot configuration description must be located in the same file as this line of HTML code and must have this example name logo.
Tag<МАР>
A special tag is used to describe the configuration of areas of the image map<МАР>, whose only parameter is NAME. The value of the NAME parameter specifies the name that must match the name in USEMAP. Tag<МАР>requires a closing tag. Inside this pair of tags there should be descriptions of active areas of the map, for which a special tag is used .
Tag
Each individual tag specifies one active region. The ending tag is not required. Active regions may overlap. If a certain point belongs simultaneously to several active areas, then the link whose description is located first in the list of areas will be implemented.
Tag parameters are SHAPE, COORDS, HREF, NOHREF, TARGET, and ALT. Let's consider the purpose of these parameters.
SHAPE parameter
The SHAPE parameter determines the shape of the active area. Valid values are rect, circle, poly, default. These values define areas in the form of a rectangle, circle, or polygon. The last value - default - defines all points in the area. If the SHAPE parameter is omitted, the default value is rect, i.e. an area in the form of a rectangle.
Warning
Do not confuse the area of type default, which describes all points in the image, and the default value of the SHAPE parameter, which is rect.
Note
Unlike the server version, where the default area defined all points on the image that do not belong to any active area, for the client option the default area defines all the image points. Therefore, in this case, the description of the default area should be located last in the list of active areas. If, for example, the description of the default area is placed first, then the link defined by this area will always be implemented for the client version, and all other links will be ignored (this is how this type of area is implemented in Netscape). For the server version, the location of the default area description does not matter. This difference is taken into account in the examples given at the end of the chapter.
Advice
Note also that not all browsers support the default area type. In particular, Microsoft Internet Explorer does not allow this type of scope at all. Therefore, instead of an area of the default type, we can recommend setting a rectangular area with dimensions equal to the size of the entire image. Naturally, such an area should be described last. This is exactly what some image map editing programs do, which will be discussed below.
COORDS parameter
The COORDS parameter specifies the coordinates of a single active area. The value of the parameter is a list of coordinates of points defining the active area, separated by commas. Coordinates are written as non-negative integers. The origin is located in the upper left corner of the image, which corresponds to the value 0.0. The first number determines the horizontal coordinate, the second - the vertical one. The list of coordinates depends on the type of area.
For an area of type rect, the coordinates of the upper left and lower right corners of the rectangle are specified.
For an area of type circle, three numbers are specified - the coordinates of the center of the circle and the radius.
For an area of type poly, the coordinates of the polygon vertices are specified in the required order. Note that the last point in the list of coordinates does not have to coincide with the first. If they do not match, the browser will automatically connect the last point to the first when interpreting the data for that region shape. Different image map editors work differently in this regard - some add the first point to the end of the list, while others do not. The quantitative restrictions on the number of vertices are quite large and cover almost all conceivable needs. At least a polygon with 100 vertices is reliably processed by all leading browsers. There is a limitation associated with the HTML language itself, according to which a list cannot contain more than 1024 values. The polygon may well be non-convex.
The default type area does not require specifying coordinates.
HREF and NOHREF parameters
The HREF and NOHREF options are mutually exclusive. If none of these parameters are specified, then the region is considered to have no link. The same thing explicitly defines the NOHREF parameter, which does not require a value. The HREF parameter specifies the link address, which can be written in absolute or relative form. The rules for writing completely coincide with the rules for writing links in a tag<А>.
The NOHREF parameter is useful to exclude part of the active region. Let, for example, you need to create an active area in the form of a ring. This type of area is not included in the list of possible areas, but it can be implemented by specifying two circular areas. To do this, you must first define an area of smaller radius and specify NOHREF as the parameter. Next, you need to specify an area of a larger radius with the center at the same point and specify the desired link. Then the area inside the ring, defined by two circles of different radii, will have the necessary link. Using an approach based on the mutual overlap of areas will allow you to build areas of very diverse shapes.
TARGET parameter
The TARGET parameter is used when working with frames. Its purpose is to indicate the name of the frame in which the document downloaded from this link will be placed. For more information on using this option, see the chapter on working with frames.
ALT parameter
The ALT parameter allows you to write alternative text for each of the active areas of the image. Essentially, this text will only play the role of a comment for the creator of the document. If the alternative text written for the entire image (in the tag ), is used to display it on the screen when working with image loading disabled, then the alternative text for active areas will never appear on the screen.
Here is an example of specifying areas of various types:
<МАР NAME="logo">
!}
HREF="p.htm" ALT="Polygon"> !}
This code snippet is placed in an HTML file. Often all image map descriptions of one document are brought together and placed at the beginning of the section
document. This approach is close to programmers, who usually, when writing programs, separate the descriptive part of the program from the executable part, which simplifies the understanding of the written code, and is sometimes determined by the requirements of the compiler.Combination of client and server options
It is acceptable to use a combined option, in which both parameters - USEMAP and ISMAP - are defined for the same image, which implies the use of this image as a reference for both the client and server options. USEMAP is the dominant parameter. This means that a browser that supports the client option will use USEMAP, ignoring the ISMAP parameter instructions. Those browsers that do not support the client option and do not understand the purpose of the USEMAP parameter, according to general HTML rules, will ignore its presence and will implement the server option when they detect the presence of the ISMAP parameter. The combined option is more reliable, but requires data to configure areas for both options. Nowadays, the need to use the combined option is increasingly decreasing, since all leading browsers support the client option. However, the Netscape home pages, which any user of the Netscape browser has probably encountered, are made in a combined version.
Here is an example of a combined option:
<А HREF="http://www.anywhere.com/testmap/logo.map">
Note
The USEMAP parameter is also dominant over the link defined by the tag<А>. So, if the image used to implement the image-map concept in the client version is written inside the scope of the tag<А HREF>, then the link identified by the last tag will be ignored by browsers that support the client-side option. Let, for example, have the following fragment:
<А HREF=NoMaps.htm> .
On the one hand, the entire image is a link to a document called NoMaps.htm. On the other hand, the presence of the USEMAP parameter defines this image as the reference image for the corresponding image map. The reference to the NoMaps.htm document will be ignored due to the presence of the USEMAP parameter and regardless of other factors.
Features of using image maps
Let us note some features in the use of image maps in the client version. When the user moves the mouse within an image that implements a client-side option, the corresponding URL is displayed in the status bar at the bottom of the Netscape browser. In the server-side option, the URL is not displayed because the information is hosted on a server, which is not accessible until the user clicks on the image. The first option is more informative, since the user sees the addresses of the links and can also determine the location of the image without links. The server version displays numbers that are relative mouse coordinates on the image and do not provide any information about the links and their presence.
Alternative means of navigation
The use of image maps has become common, but we should not forget that not all Web users can use graphics or want to work with image loading disabled to reduce file transfer times. Therefore, you need to provide some other, alternative means of navigation on the page for them. Otherwise, users will not be able to find on the page at all and, accordingly, implement those links that are defined only by the image map.
As an alternative, you can create a separate section with a text description of the links and corresponding URLs. You can also create a link to a text menu that has the same connections as the image map. Whatever approach you choose, you need to make sure that all links are available for the browser's text mode.
Let us give an example of a real-life document in which these issues are resolved. One of the pages of the well-known company Hewlett-Packard shows a fragment that contains an image map. In the middle of the page there is a list of ten different types of equipment, each of which has a link to the corresponding document. In fact, there is a picture on the page, which is the reference image for the map. In this image, ten rectangular zones are highlighted, which are active regions.
If you load this page with the image loading mode disabled, you will see a picture where, instead of an image map, there is only a small icon showing the location of the image and. text that has been set as an alternative text for the entire given image. Obviously, you won't be able to use the links here. To solve this issue, below the image there is a regular text menu, which completely repeats the list shown in the image, with the corresponding links. Therefore, if image loading is disabled, the user will still be able to implement the necessary link transitions using the duplicate text menu. When loading an image, the text menu only duplicates the options for selecting links.
Image Mapping Tools
Creating image maps requires two steps: preparing a reference image on which the active regions will subsequently be defined, and developing a configuration file that describes the geometric parameters of the active regions. Preparing an image that will serve as the basis for an image map is no different from preparing regular images embedded on Web pages. To do this, you can use any graphic editor or use a ready-made image.
In the second step, you need to mark the active areas in the image and match them with the corresponding link addresses. Preparing the configuration file is the most difficult step in creating image maps. In principle, a manual way to set the boundaries of active areas in the image is possible. For example, when working in a graphic editor, you can mark individual points, record their coordinates, and then create a file describing the geometric parameters of the selected areas. However, this approach is extremely inconvenient and cumbersome.
To automate the process of marking areas in an image, there are a number of programs, most of which are very similar to each other. They allow you to create and modify configuration files by working directly with the image on the screen. Most programs are stand-alone utilities that operate independently and are essentially add-ons to HTML editors. These programs allow you to save the generated configuration file either to the Windows clipboard or to a file on disk. In the first case, a typical option is the joint operation of an image map editing program and some kind of HTML editor or regular text editor. If the program allows you to save the configuration file on disk, then it can be used completely autonomously. All programs allow you to mark areas of three main types on an image - rect, circle and poly. Some editors support the default type. Perhaps the only criterion for choosing an image map editing program is its ease of use, since all programs are very similar in functional properties. If the program's interface seems inconvenient to you, you can stop using it and choose another one.
Let's look at some of the existing programs.
MapEdit program
One of the simplest and most famous editing programs configuration files is the MapEdit utility developed by Thomas Boutell. This program has been around for several years and has been implemented for various platforms. In particular, there are versions for Windows 3.x and Windows 95/98/NT. As with most programs, there were a number of versions of this utility. Currently the latest version available for Windows 95/98/NT is version 2.6 (September 1999). Information about the program can be obtained at:
http://www.boutell.cora/mapedit/
MapEdit is shareware and has a 30-day evaluation period, after which registration is required. The program is small in size - the distribution takes up about 300 KB, and at the same time it has almost all the necessary capabilities.
The program allows you to edit configuration files for both the server version (in NCSA and CERN formats) and the client version. It is possible to visually create active areas in the form of rectangles, circles and polygons, as well as define the link address for the default area.
Let's take a brief look at the main features of this program. After starting MapEdit, the main window appears, containing a splash screen (Fig. 6.3) and a menu. It is possible to edit existing files for both server and client versions of image maps. It is also possible to create a new configuration file, but this only applies to the server version. The client version requires a source HTML file with links to embedded images that will be used as reference for image maps.
Note
The inability to create a new HTML file using MapEdit can be easily circumvented. To do this, you should run the program in file creation mode in one of the server-side formats (NCSA and CERN), perform all the necessary actions, and then save the results in Save as mode, specifying the Client Side Map format. An HTML file will be created, which can later be used as a ready-made fragment of an HTML document.
Suppose we need to create a new configuration file for the server version of image maps. Select Open/Create Map from the menu
File. A dialog box will appear (Fig. 6.4), in which you should specify the name of the configuration file to be created (for example, Blazons.map), specify an existing image file and the format of the created file (NCSA or CERN). The image file can be in GIF, JPG or PNG format.

Rice. 6. 3 . MapEdit splash screen

Rice. 6. 4 . Open/Create Map dialog box for creating a configuration file
Note
Many of the server-side configuration file interpretation programs require that the file have a MAP extension. It is recommended to always adhere to this rule.
The program will load the selected image file, on which it will be possible to mark active areas (Fig. 6.5).
To do this, you need to select the shape of the active area - rectangle, circle or rectangle by clicking the corresponding icon or selecting the desired item from the Tools menu (Fig. 6.6).
Further actions are performed directly on the image by marking points with the mouse. For a rectangular area, the upper left and lower right corners are marked, for a circular area - the center and one of the points on the circle, for a polygon its vertices are specified. For example in Fig. Figure 6.5 shows the case when three active areas of different shapes are already marked on the image. Note that the lines limiting the active areas serve only to visualize them when working in the editor and do not change the image file in any way. The image in this example essentially contains three separate pictures (the coats of arms of the cities of St. Petersburg, Tomsk and Yakutsk are depicted), which is usually not typical for realistic images. However, for images containing, for example, a set of control buttons, this situation is quite typical.

Rice. 6. 5 . An image with different types of hotspots labeled

Rice. 6. 6 . Tools menu

Rice. 6. 7 . Object URL dialog box for specifying a URL and an optional comment
After marking any of the areas, you should specify the link address corresponding to this area, as well as commentary information (Fig. 6.7). You can set a default link address for the area, which will be implemented for the part of the image area that is not included in any of the active areas (Fig. 6.8).
After marking the areas, you can visually inspect or change the created active areas using the Test item of the Edit menu. The last step is to save the results as a configuration file (Save item in the File menu). You can also use the Save As item, in which you specify the required format for saving the file (Fig. 6.9).

Rice. 6. 8 . Default URL dialog box for setting the default URL for the scope

Rice. 6. 9 . Save As Command Dialog Box
Note
Older versions of MapEdit contained a small bug related to setting the format of the saved configuration file. If the CERN format was specified when creating the file, then when saving data in Save mode, the file will still be saved in the NCSA format. It is possible to create a CERN format file only when using the Save as mode and specifying the required format.
For this example, a file called Blazons.map will be created containing the following information (NCSA format):
#Coat of arms of the city of Tomsk
rect www.ifmo.ru/sergeev/tomsk.htm 35.58 187.244
#Coat of arms of the city of Yakutsk
circle www.ifmo.ru/sergeev/jakutsk.htm 364.150 468.150
#Coat of arms of the city of St. Petersburg
poly www.ifmo.ru/sergeev/Spb.htm 537.61 700.61 700.230 618.256 537.231
The same data saved by the editor in CERN format will look like this:
rect (35.58) (187.244) www.ifmo.ru/sergeev/tomsk.htm circle (364.150) 104 www.ifmo.ru/sergeev/jakutsk.htm poly (537.61) (700.61) (700.230) (618,256) (537,231) www.ifmo.ru/sergeev/Spb.htm
Please note that comments are not allowed in this format, so this information will be lost when you save the file.
Let's consider the task of creating a client version of an image map. To solve this problem, you must have an HTML source file containing at least one embedded image. This source file can be created in advance with any text editor or special HTML editor. Let's say there is a file called CSIM.HTM containing the following code:
This file should be opened in the MapEdit editor (Fig. 6.10). Unlike the option in which the configuration file was created, here it is not necessary to specify the name of the image file in the Open/Create Map menu item.

Rice. 6.1 0 . Open/Create Map dialog box for opening an existing HTML file

Rice. 6.1 1 . Select Inline Image Dialog Box
After opening the source HTML file, the editor will display a dialog box with a list of all built-in images, from which you need to select the one you need (Fig. 6.11). Of course, the file with the selected image must exist.
Further work on marking active areas is completely identical to the previous case. After saving the markup results, the source file will be changed, and for the example given it will look like this:
href="tomsk.htm">
href="jakutsk.htm">
coords="537,61,700,61, 700, 230, 618, 256, 537,231" href="Spb.htm">
Please note that the editor automatically assigns a name to describe the image map that matches the name of the reference image file. For this example, the file with the image was named Blazons.gif, so the name parameter of the tag<тар>was assigned the value "Blazons".
Note
The MapEdit editor does not work quite correctly with characters of the Russian alphabet. Some Russian letters disappear when the file is saved and spaces appear in their place. The easiest way out of this situation is to add Russian text after finishing work in the editor.
Map THIS!
Another utility for creating and editing configuration files for image maps is the Map THIS! program, information about which can be obtained at:
http://galadriel.ecaetc.ohio-state.edu/tc/mt/.
Working with this program is ideologically similar to the MapEdit program. The basis of working with the program is the visual design of active areas with further saving of the results in a file in one of the selected formats. The editor supports both server-side and client-side image map formats (NCSA and CERN). Images can be loaded from GIF and JPG files.
Here are examples of configuration files created by this program. For the example given in the previous section, the file saved in the NCSA format would look like this:
#$MTIMFH
#$-:Image Map file created by Map THIS!
#$-:Map THIS! free image map editor by Todd C. Wilson
#$-:Please do not edit lines starting with "#$"
#$VERSION:1.30
#$TITLE: Blazons
#$DESCRIPTION:Server version of the image map
#$DATE:Tue Sep 14 12:10:42 1999
#$PATH:C:\Program Files\Mapthis\
#$GIF:Blazons.gif
#$FORMAT:ncsa
#$EOH
default default.htm
# Coat of arms of the city of Tomsk
rect Tomsk.htm 33.60 191.246
# Coat of arms of the city of Yakutsk
circle Jakutsk.htm 366,147 366,256
# Coat of arms of the city of St. Petersburg
poly Spb.htm 534.62 699.62 698.236 626.261 534.235 534.62
Unlike the MapEdit program, this editor writes quite a lot of commentary information into the output file, including brief information about the program itself, the date the file was created, etc. Moreover, after the # symbol, which means the beginning of a comment line, the editor adds a $ symbol for comment lines, created by the editor himself. Pay attention to the fourth line of the code above, which asks you not to edit comments inserted by the editor.
The same example saved in CERN format would look like:
rect (4096,4096) (4096,4096) mt:#$MTIMFH
rect (4096,4096) (4096,4096) mt:#$-:Image Map file created by Map THIS!
rect (4096,4096) (4096,4096) mt:#$-:Map THIS! free image map editor
by Todd C. Wilson
rect (4096,4096) (4096,4096) mt:#$-:Please do not edit lines starting
with "#$"
rect (4096,4096) (4096,4096) mt:#$VERSION:1.30
rect (4096,4096) (4096,4096) mt:#$TITLE: Blazons
rect (4096,4096) (4096,4096) mt:#$DESCRIPTION: Server version
image maps
rect (4096.4096) (4096.4096) mt:#$
rect (4096,4096) (4096,4096) mt:#$DATE:Tue Sep 14 12:10:42 1999
rect (4096,4096) (4096,4096) mt:#$PATH:C:\Program Files\Mapthis\
rect (4096,4096) (4096,4096) mt:#$GIF:Blazons.gif
rect (4096,4096) (4096,4096) mt:#$FORMAT:cern
rect (4096,4096) (4096,4096) mt:#$EOH
default default.htm
rect (4096,4096) (4096,4096) mt:# Coat of arms of the city of Tomsk
rectangle (33.60) (191,246) Tomsk.htm
rect (4096,4096) (4096,4096) mt:# Coat of arms of the city of Yakutsk
circ (366,147) 109 Jakutsk.htm
rect (4096,4096) (4096,4096) mt:# Coat of arms of the city of St. Petersburg
polygon (534.62) (699.62) (698.236) (626.261) (534.235) (534.62) Spb.htm
As you can see from the code above, the editor uses a somewhat artificial technique to store comments, both entered by the user and generated by the program itself. Let us remind you that the CERN format does not allow you to specify comment lines, so the editor creates a line like
rect (4096,4096) (4096,4096),
at the end of which you can place any text. In essence, such a line describes a rectangle, which is obviously located outside the screen, so its presence does not matter. Of course, in this case, the text of the configuration file becomes much more cumbersome and inconvenient to read, which, however, does not interfere with the operation of programs. This technique of saving comments can be adopted.
The same example, saved as an HTML file (for the client version of image maps) will look like:
<МАР NAME="Blazons">
ALT="Coat of arms of the city of Tomsk"> !}
ALT="Coat of arms of the city of Yakutsk"> !}
HREF="Spb.htm" ALT="Coat of arms of the city of St. Petersburg"> !}
Here, unlike the MapEdit program, the name of the image map must be specified manually, so it may not coincide with the name of the file with the reference image.
CrossEye program
CrossEye configuration file editor program, created by the famous Australian company Sausage Software. This program will be welcomed by fans of the popular HTML editor HotDog, since it was created by the same company and has a very attractive, humorous interface.
Information about the CrossEye package can be obtained from:
http://www.sausage.com.au.
Distinctive features of the program are the rather large size of the distribution kit (about 2.5 MB), as well as a short period of time (14 days) during which it can be used in evaluation mode. The large size of programs is typical for everything software, created by the company Sausage Software, which is apparently due to the choice of tools used for development (Visual Basic).
Unfortunately, the program does not have a number of necessary properties. For example, there is no ability to read an existing HTML file, so it is impossible to edit an existing image map that was created earlier. It is also not possible to save your work directly to an HTML file. Saving results is only possible in a file with special extension EYE, which has a binary form and can be used in the future only in this editor. The generated HTML code is written to the Windows clipboard, from where it can be copied to any text editor.
As in all the editors described above, the creation and editing of active areas is carried out directly on the image, but the image is loaded into a window, the size of which, for unknown reasons, cannot be changed. If the image is larger than the window, you can scroll to view the image, but you cannot set an active area that extends beyond the viewing window.
For the client-side image map, the editor does not prompt you to set a default URL for the area at all. This may be done on purpose, since not all browsers support the default area type. However, the editors described above solve this problem very elegantly by automatically replacing the default area with a rectangular area with dimensions equal to the image dimensions.
The shortcomings are, in a sense, compensated for by certain additional features of the editor. In particular, you can find out that the parrot, which is visible in the upper right corner of the above picture, is called Polly. He is quite talkative, and users working on a computer equipped with sound card, from time to time they will hear the exclamations of a parrot, which, however, have nothing to do with the actions being performed. And in one of the editor settings dialog boxes there is even a special item that allows you to shut up the poor parrot. Here is an example of top-notch service. Apparently, thanks to the listed properties, the rating of this editor is estimated http://www.tucows.com, is very high, which cannot be said about the two programs described above.
Ultimately, the choice of editor to create image maps is up to the user.
Vlad Merzhevich
Image maps allow you to link links to different areas of the same image. It is implemented in two different versions - server and client. When using the server option, the browser sends a request to the server to obtain the address of the selected link and waits for a response with the required information. This approach requires additional time to wait for the result and separate files for each image map.
In the client version, the map is located in the same HTML document as the link to the image.
Client version of the image map
To indicate that an image is a map, use the tag's usemap attribute . The value is a link to a description of the card configuration.
Example 1: Using an image map
![]()
The usemap attribute is used to indicate to the browser that the image is a map. It is a link to a description of the card configuration, which is specified by the tag
AREA tag attributes
shape
Defines the shape of the active area. The shape can be in the form of a circle (circle), rectangle (rect), polygon (poly).
alt
Adds alternative text for each area. Serves only as a comment for the link, as it is not displayed on the screen.
coords
Sets the coordinates of the active area. Coordinates are measured in pixels from the upper left corner of the image, which corresponds to the value 0.0. The first number is the horizontal coordinate, the second is the vertical coordinate. The list of coordinates depends on the shape of the area.
For a circle, three numbers are specified - the coordinates of the center of the circle and the radius.
For a rectangle, the coordinates of the upper left and lower right corners.
For a polygon, the coordinates of its vertices are specified (Fig. 2).

Rice. 2. Coordinate points for the polygon
href
Image maps allow you to create links to different areas of the same image. Using this approach is clearer than regular text links and allows you to use just one graphic file to organize links. However, you should not assume that image maps should be included wherever graphical references are required. First of all, you should evaluate all the pros and cons, and also look at alternative options.
Benefits of image maps
1. Maps allow you to set any shape of the link area. Given that images are rectangular in nature, it is not possible to make a graphical link of a complex shape, for example to indicate a geographic area, without image maps. As a rule, in geographic subjects, image maps are used most often.
2. It’s more convenient to work with one file - you don’t have to worry about joining individual fragments and the drawing can be easily placed in the right place.
Flaws
1. You cannot set tooltip and alt text for individual areas. Alternative text allows you to get text information about a picture when loading images is disabled in the browser. Because images are loaded after the browser receives information about them, the image's replacement text appears earlier. And as it loads, the text will be replaced by an image. For image maps, this feature is relevant, because if you turn off image viewing, which many users do, you will end up seeing only one empty rectangle.
2. With a complex shape of the link area, the amount of HTML code increases. The contour is approximated by a set of straight segments; for each point of such a segment, two coordinates should be specified, and the total number of such points can be quite large. In fairness, it should be noted that complex forms are a special case and are used quite rarely.
3. With image cards you cannot create various effects that are available when cutting one picture into fragments: rolling effect, partial animation, individual optimization of pictures for their fast loading.
Usability
From the point of view of user convenience, image maps have only one advantage - links of various shapes. This adds clarity to the presentation of information - we are not limited to the rectangular shape of the link and can use links of complex configuration for our own purposes. In all other respects, they are of no use - regular text links are more informative and they are not afraid of turning off the display of images in the browser. The fact that one image loads faster than the same picture cut into fragments and saved as a set of graphic files is easily circumvented. Each of these final files can be reduced using individual optimization settings. As a result, the total volume of all fragments will take up less space than one image. One should not discount the psychological factor - it seems to a person that a set of small pictures loads faster than one large one.
The main drawback of the maps is that there are no clearly defined boundaries of the links. Therefore, these boundaries have to be highlighted using different means already in the image. If the picture does not load for some reason, then understanding the set of links becomes very problematic.
Alternative options
There is not always an urgent need to use image maps, so you should pay attention to the fact that there are other possible options for completing the task.
Using Flash
In Flash videos, you can create different link areas using vector graphics. Thanks to its extensive capabilities, you can create stunning menus and navigation in Flash. But here, too, caution is required so as not to lose the forest for the trees.
Image slicing
This is one of the popular means in design. In this case, one image is cut using special programs into fragments that are finally brought together, creating the illusion of a complete picture. Although the cutting areas can only be rectangular, in most cases this is sufficient for creating links. For each fragment, you can select the most suitable graphic format in which it will be saved, optimization parameters, and add alternative text. Then, even with the display of images disabled, the boundaries of the areas and the text replacing the image will be clearly visible.
Summary
As it turned out, there is only one reason to use image maps - a complex form of links dictated by design tasks. A typical application is regions of a geographic map that serve as references. In all other cases, you can get by with text links, and if you need to create graphic navigation, one image can be cut into fragments for convenience. This approach will create more convenience for users, especially those who, for various reasons, disable the display of images in the browser. You need to remember them too.